这个项目比较简单,介绍了ReportLab的用法。
首先要用到的是画折线类,PolyLine,用法很简单,看下面的例子:
1 from reportlab.lib import colors2 from reportlab.graphics.shapes import*3 from reportlab.graphics import renderPDF4 5 drawing = Drawing(200, 150)6 drawing.add(PolyLine([(50, 50), (100, 50), (100, 100), (50, 100), (50, 50)]))7 8 renderPDF.drawToFile(drawing, 'report2.pdf', 'Sunsports')

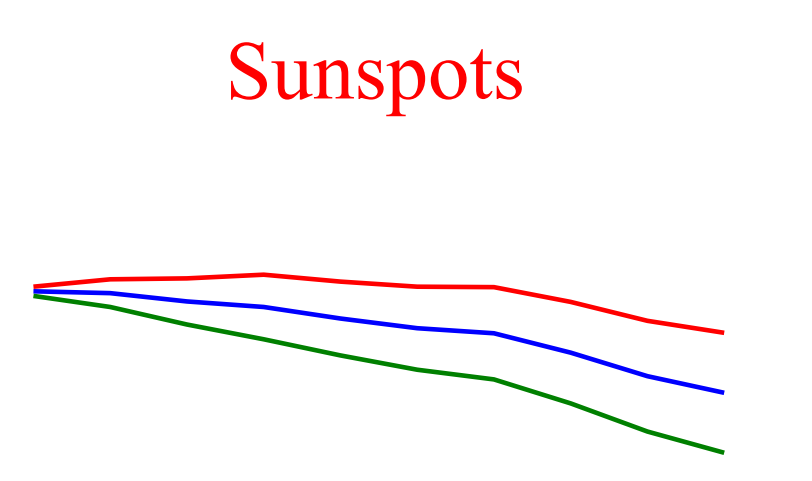
1 from reportlab.lib import colors 2 from reportlab.graphics.shapes import* 3 from reportlab.graphics import renderPDF 4 5 data=[ 6 # Year Month Predicted High Low 7 (2007, 8, 113.2, 114.2, 112.2), 8 (2007, 9, 112.8, 115.8, 109.8), 9 (2007, 10, 111.0, 116.0, 106.0),10 (2007, 11, 109.8, 116.8, 102.8),11 (2007, 12, 107.3, 115.3, 99.3),12 (2008, 1, 105.2, 114.2, 96.2),13 (2008, 2, 104.1, 114.1, 94.1),14 (2008, 3, 99.9, 110.9, 88.9),15 (2008, 4, 94.8, 106.8, 82.8),16 (2008, 5, 91.2, 104.2, 78.2)17 ]18 19 drawing = Drawing(200, 150)20 21 pred = [row[2]-40 for row in data]22 high = [row[3]-40 for row in data]23 low = [row[4]-40 for row in data]24 times = [200*((row[0]+row[1]/12.0)-2007)-110 for row in data]25 26 drawing.add(PolyLine(list(zip(times, pred)), strokeColor = colors.blue))27 drawing.add(PolyLine(list(zip(times, high)), strokeColor = colors.red))28 drawing.add(PolyLine(list(zip(times, low)), strokeColor = colors.green))29 drawing.add(String(65, 115, 'Sunspots', fontSize=18, fillColor = colors.red))30 31 renderPDF.drawToFile(drawing, 'report1.pdf', 'Sunsports')
这儿需要注意的一点是书上的写法是:
PolyLine(zip(times, pred), strokeColor = colors.blue)
但是在python3中这样写是错误的,会有 TypeError: object of type 'zip' has no len() 错误。可以改写成上述写法。
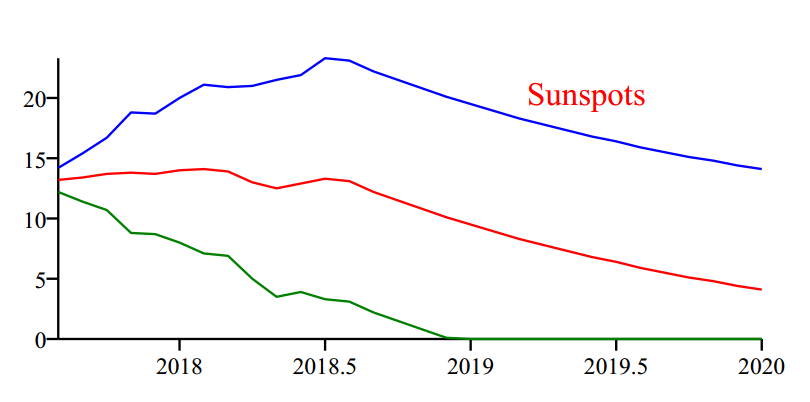
接下来是进阶版本,不难:
1 from urllib.request import urlopen #python3中在request中 2 from reportlab.graphics.shapes import * 3 from reportlab.graphics.charts.lineplots import LinePlot 4 from reportlab.graphics.charts.textlabels import Label 5 from reportlab.graphics import renderPDF 6 7 URL = 'http://services.swpc.noaa.gov/text/predicted-sunspot-radio-flux.txt' 8 COMMENT_CHARS = '#:' 9 10 drawing = Drawing(400, 200)11 data = []12 13 for line in urlopen(URL).readlines():14 line = line.decode() #这儿需要这样做,否则下面无法转化成float,具体不太清楚。。。15 if not line.isspace() and not line[0] in COMMENT_CHARS:16 data.append([float(n) for n in line.split()])17 18 pred = [row[2] for row in data]19 high = [row[3] for row in data]20 low = [row[4] for row in data]21 times = [row[0] + row[1]/12.0 for row in data]22 23 lp = LinePlot()24 lp.x = 5025 lp.y = 5026 lp.height = 12027 lp.width = 30028 29 lp.data =[tuple(zip(times, pred)), tuple(zip(times, high)), tuple(zip(times, low))] #这儿最后也要转换成元组30 31 lp.lines[0].strokeColor = colors.red32 lp.lines[1].strokeColor = colors.blue33 lp.lines[2].strokeColor = colors.green34 35 drawing.add(lp)36 drawing.add(String(250, 150, 'Sunspots', fontSize =14, fillColor = colors.red))37 38 renderPDF.drawToFile(drawing, 'report2.pdf', 'Sunspots')